Satellite images, NDVI index
Crop Monitoring
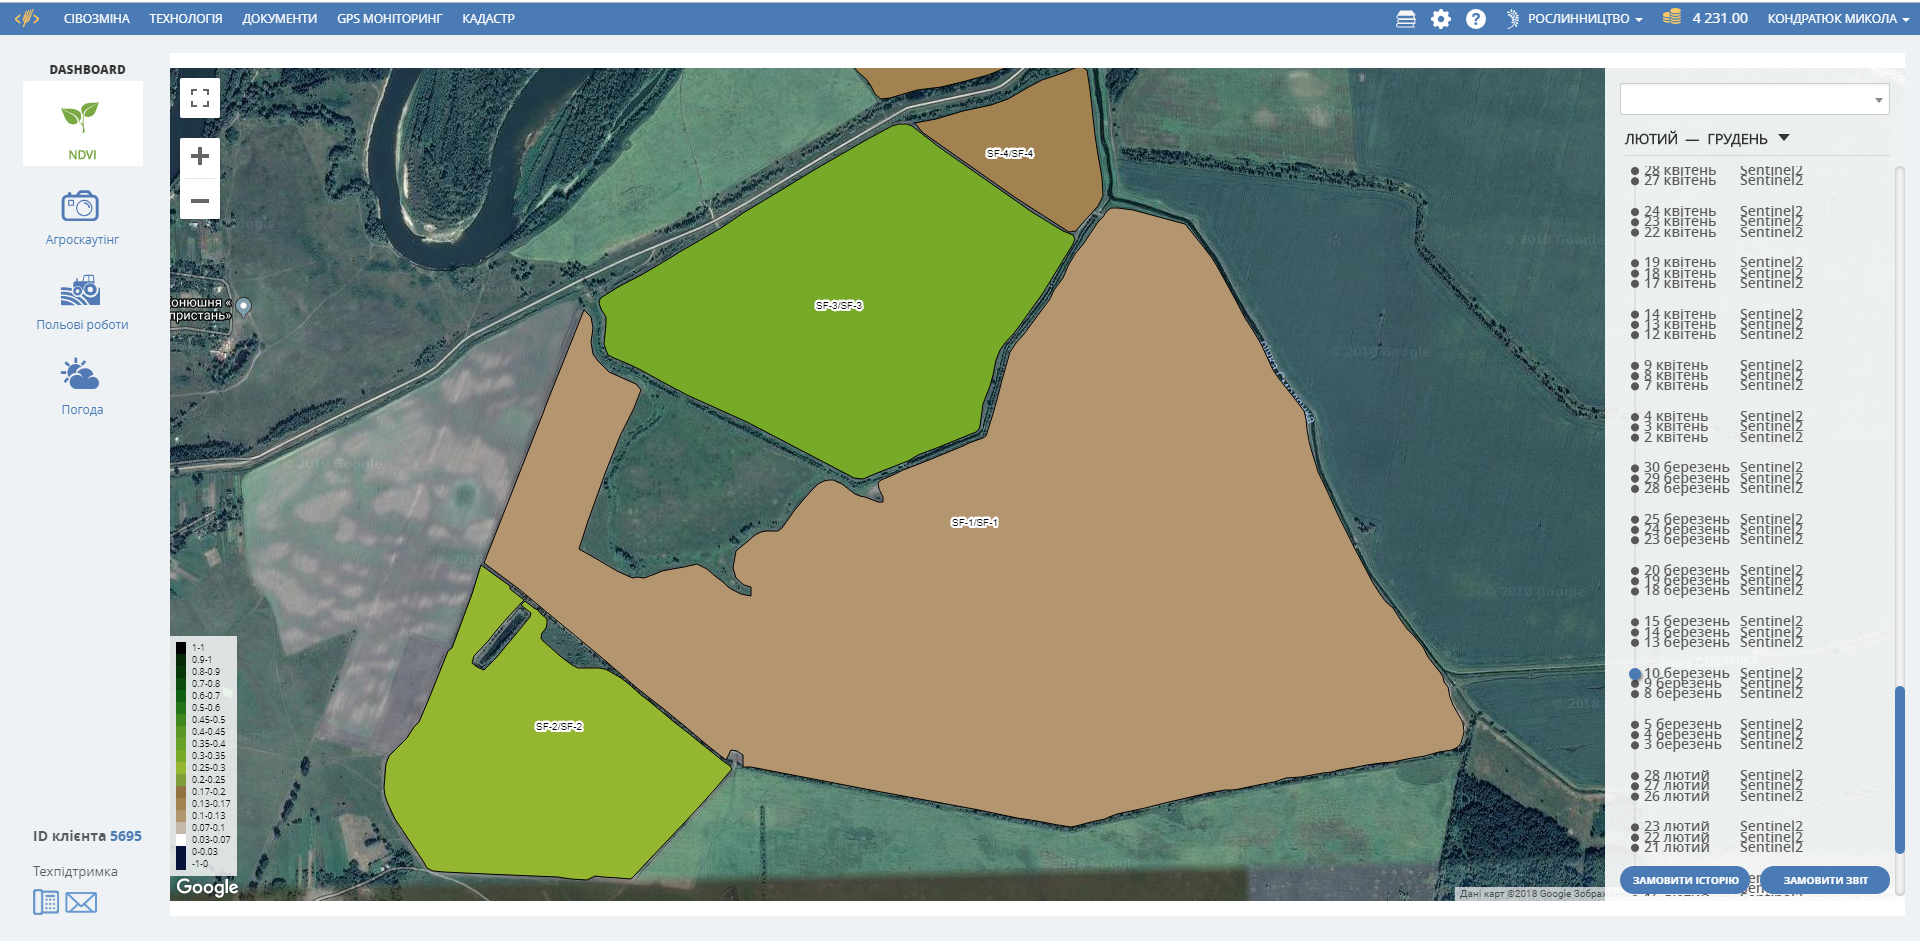
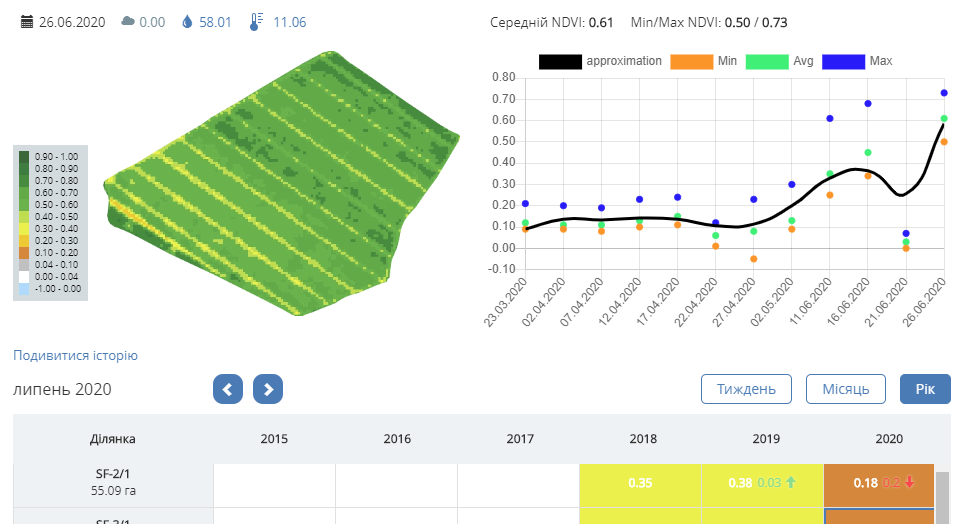
The satellite monitoring and assessment of the vegetation index NDVI (Normalized Difference Vegetation Index) will help to timely identify the fields on which crops are developing poorly, and to take corresponding management decisions. In spring, the agronomist main problem is: “How did winter wheat survive winter?” It’s still impossible to drive to the fields, but the work need to be planned based on the current state of the crop. An indispensable tool for solving this problem is satellite monitoring of the NDVI index in the
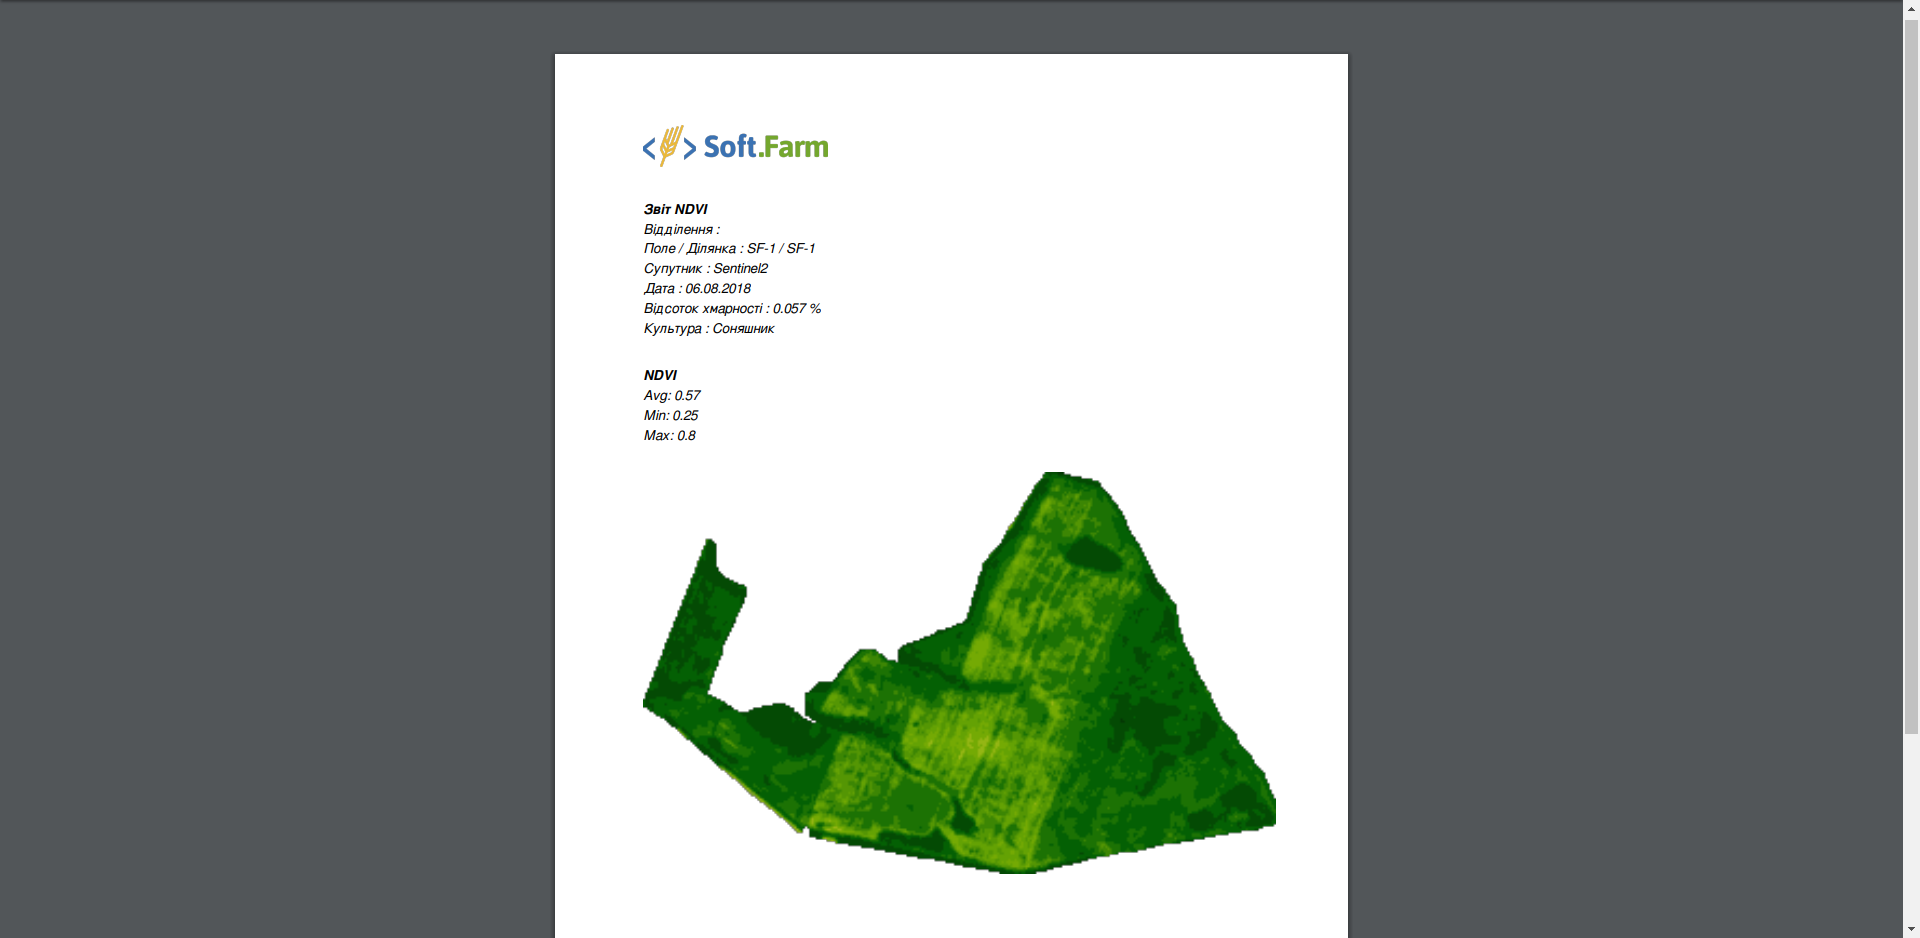
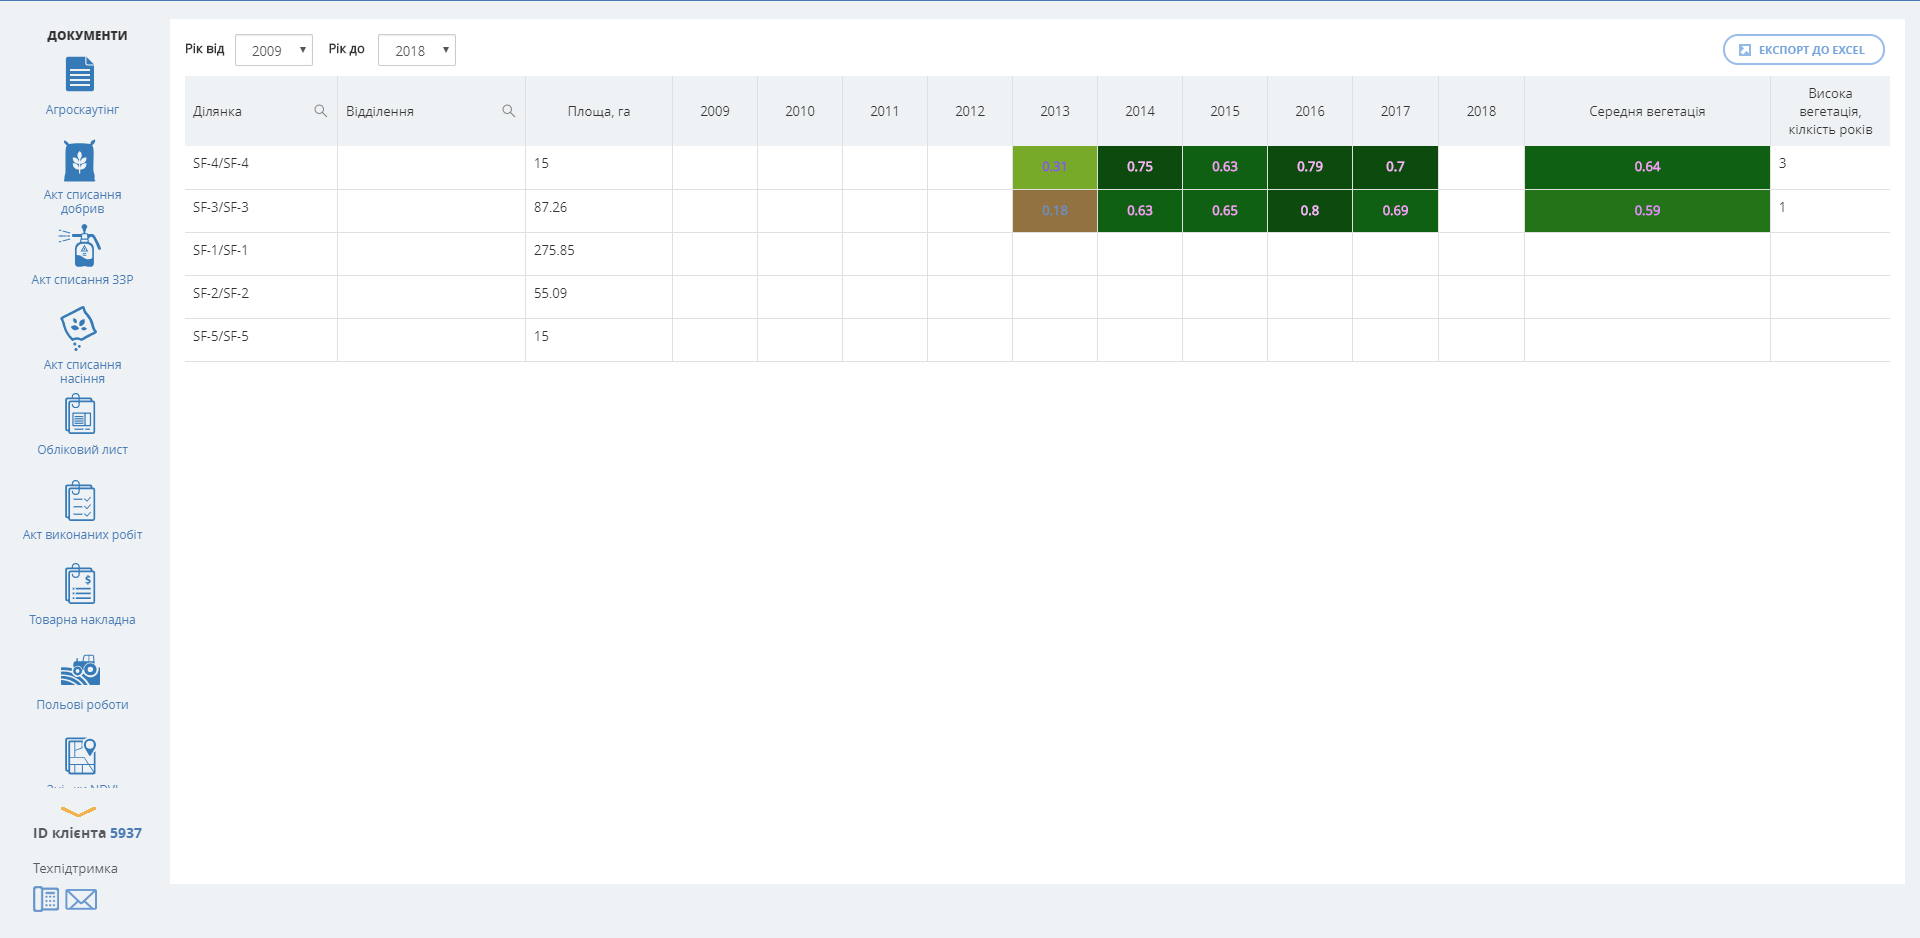
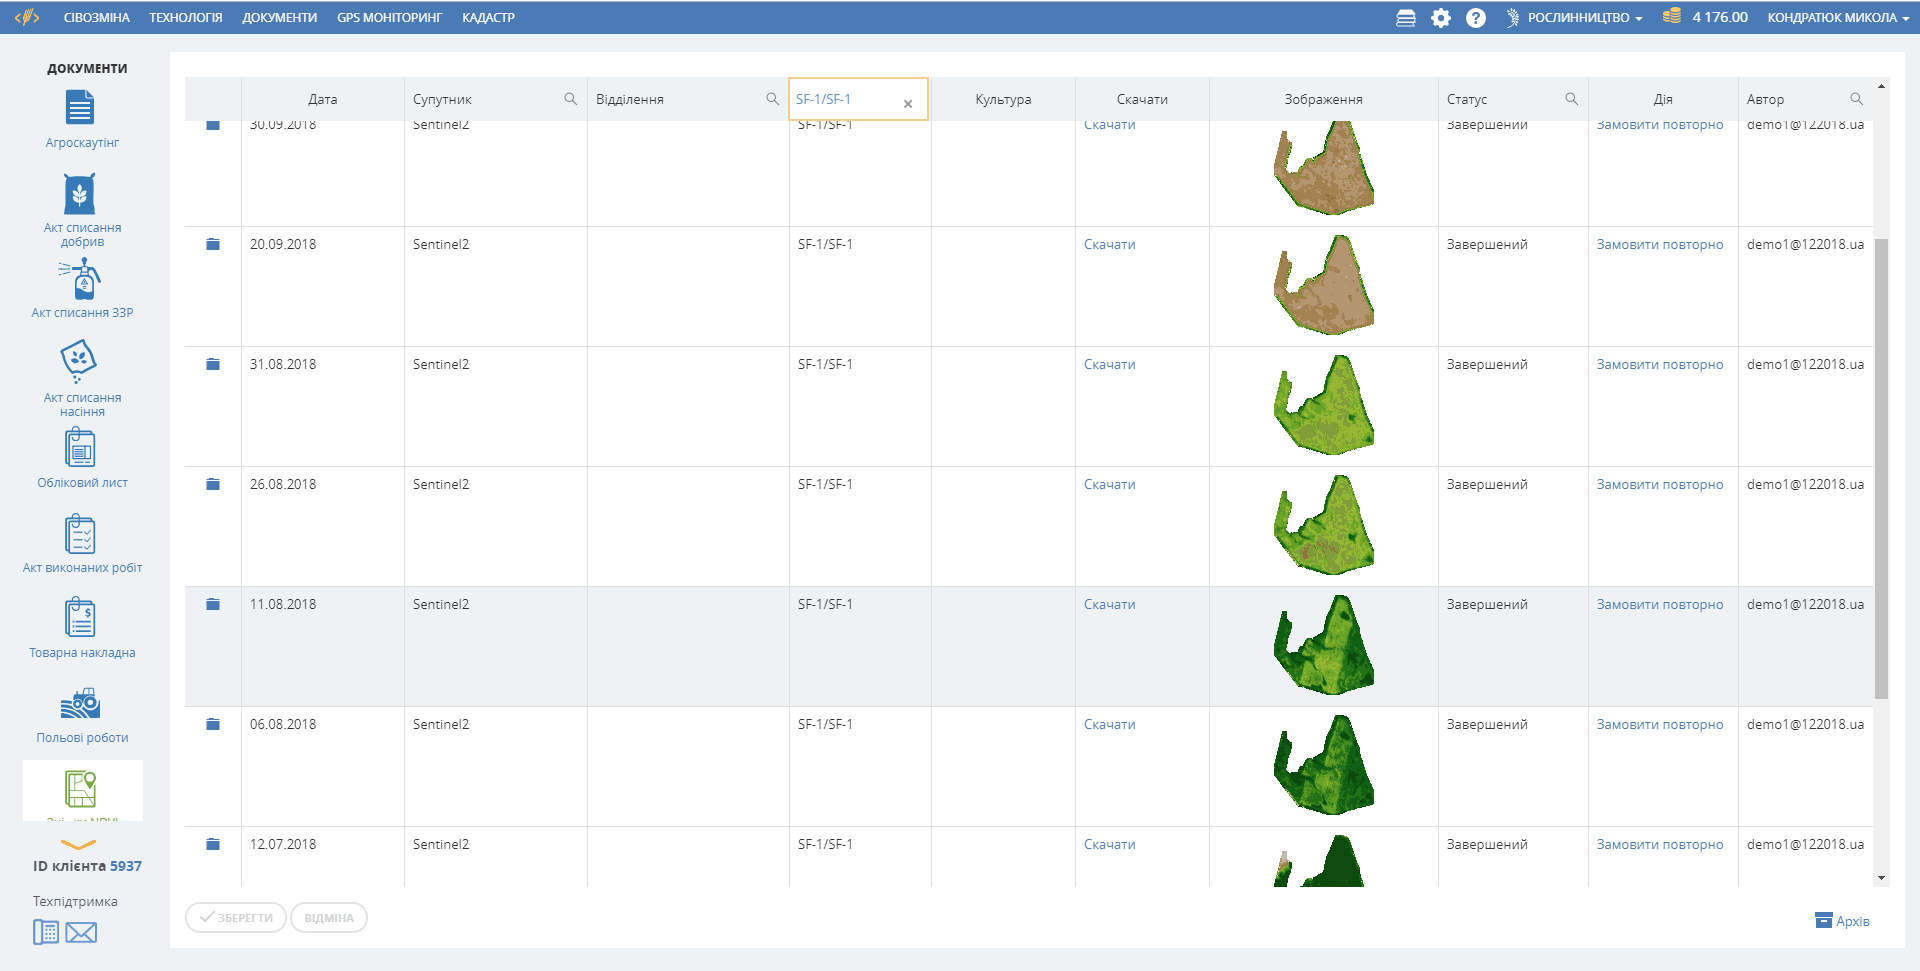
Soft.Farm system. The satellite images reflect the distribution of vegetative mass across the field, which makes it possible to identify the areas with low vegetation and to develop agrotechnical measures to improve them. Analyzing the NDVI index by year will help to determine the productive and unproductive fields and this information will help to form a crop rotation optimally. For example, an analysis of the NDVI index will reveal fields in which there has never been a high yield for five years, and you can decide whether to invest in fertilizer or to sow perennial grasses for feed. Start using satellite monitoring of crops and the NDVI index to increase profits from agricultural activity.
What tasks does "Satellite Monitoring" solve from
Soft.Farm:
- Assessment of the general condition of crops.
- Rating and comparison of fields.
- Automatic detection of problem areas.
- Initial data for targeted scouting.
- Battery deficiency.
- Identification of zones of influence of separate limiting factors.
- Formation of field productivity zones.
- Initial data for differentiated application.
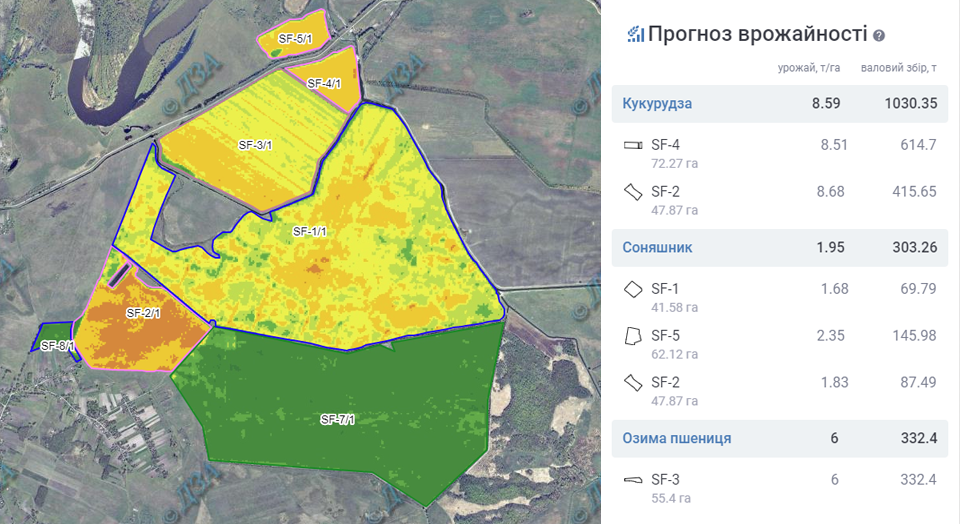
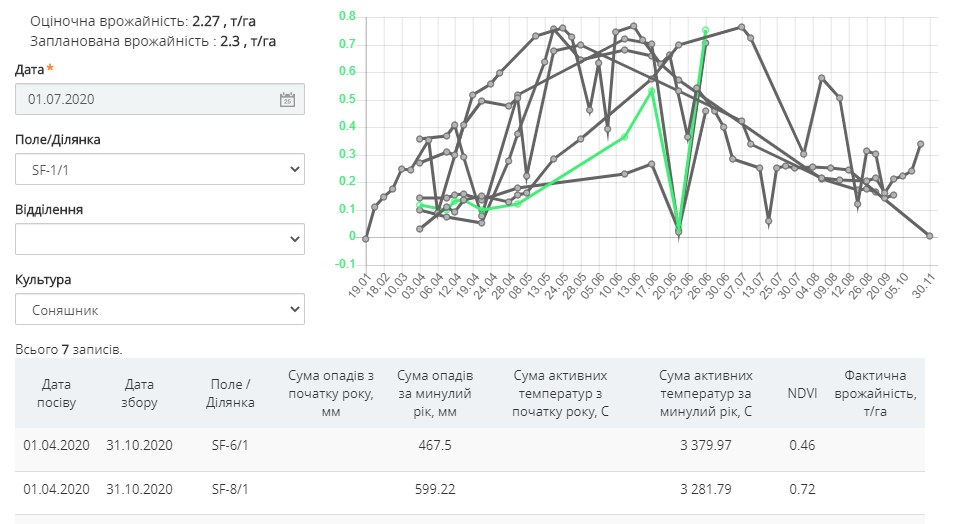
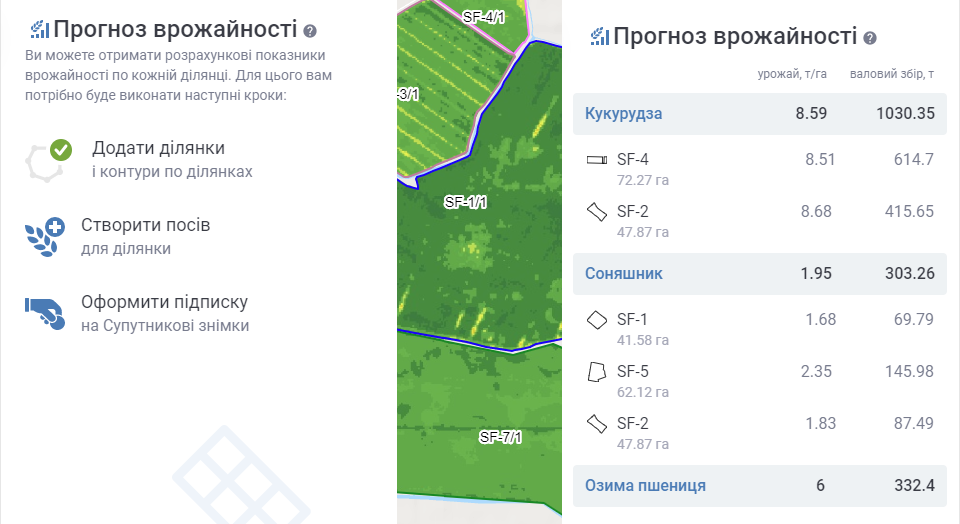
- Yield forecasting.
- Evaluation of variants in experimental fields.
Learn to analyze the NDVI vegetation index by yourself!
We have developed and are constantly improving video tutorials for the practical use of the system and its functions - satellite monitoring of the NDVI index.
Subscribe to our channel!