Yield map: from data collection to effective management decisions
09.07 2026

Nowadays every hectare of land in agriculture has its own productivity potential. Even within a single field, yields can vary significantly depending on soil properties, topography, moisture levels, cultivation technology, and many other factors. Therefore, yield maps have become a key tool in precision farming, enabling farmers to move from one-size-fits-all solutions to differentiated field management.
What is a yield map?
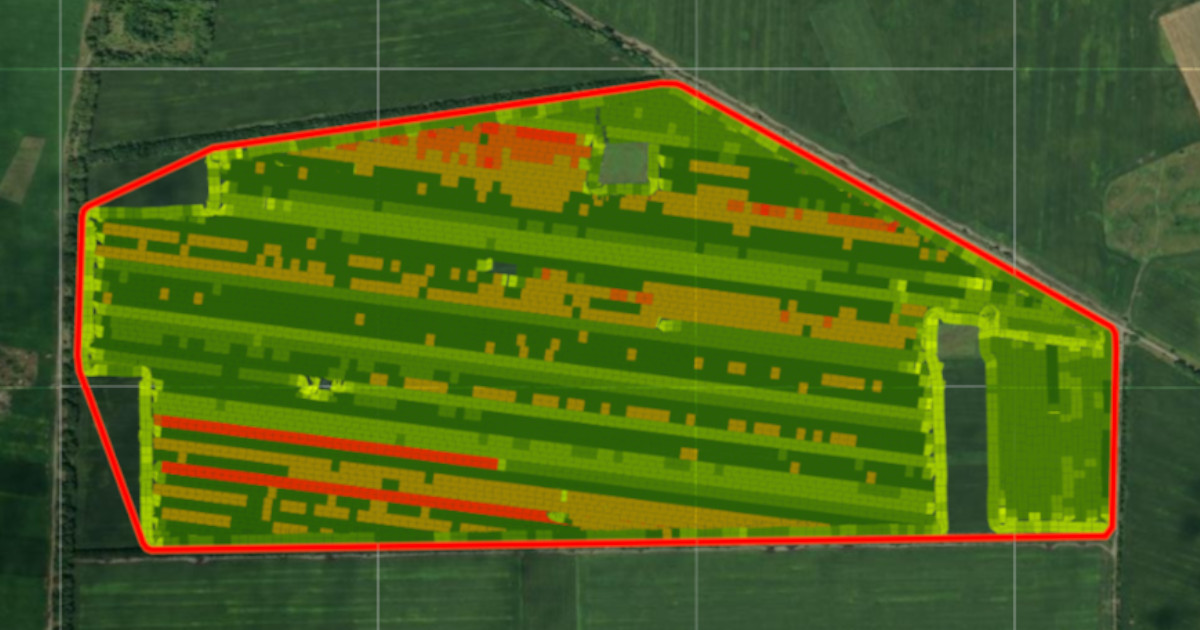
A yield map is a digital representation of the actual productivity of different areas of a field. It is generated based on data collected during harvesting using yield sensors, GPS equipment, and modern monitoring systems installed on agricultural machinery. As a result, farmers receive a detailed image of which areas of the field produced the highest yields and which require further analysis and adjustments to cultivation practices.
Today, various technological solutions are used for yield mapping:
- yield sensors installed on combine harvesters;
- GPS navigation for precise positioning of each yield indicator;
- telemetry and real-time data transmission systems;
- unmanned aerial vehicles for additional crop analysis;
- software for processing and visualizing agronomic data.
These tools make it possible to accumulate large amounts of information on field conditions and crop growth results over several seasons. While a yield map does not guarantee improved farm efficiency, it's important to note that the primary value lies not only in collecting data but, above all, in its proper analysis and interpretation. Without detailed analysis, a map remains nothing more than a collection of colored zones. It's essential to understand the causes of productive and problematic areas and establish relationships between yield, soil agrochemical parameters, field cultivation history, and weather conditions to make informed management decisions. This is where modern digital tools become especially crucial.
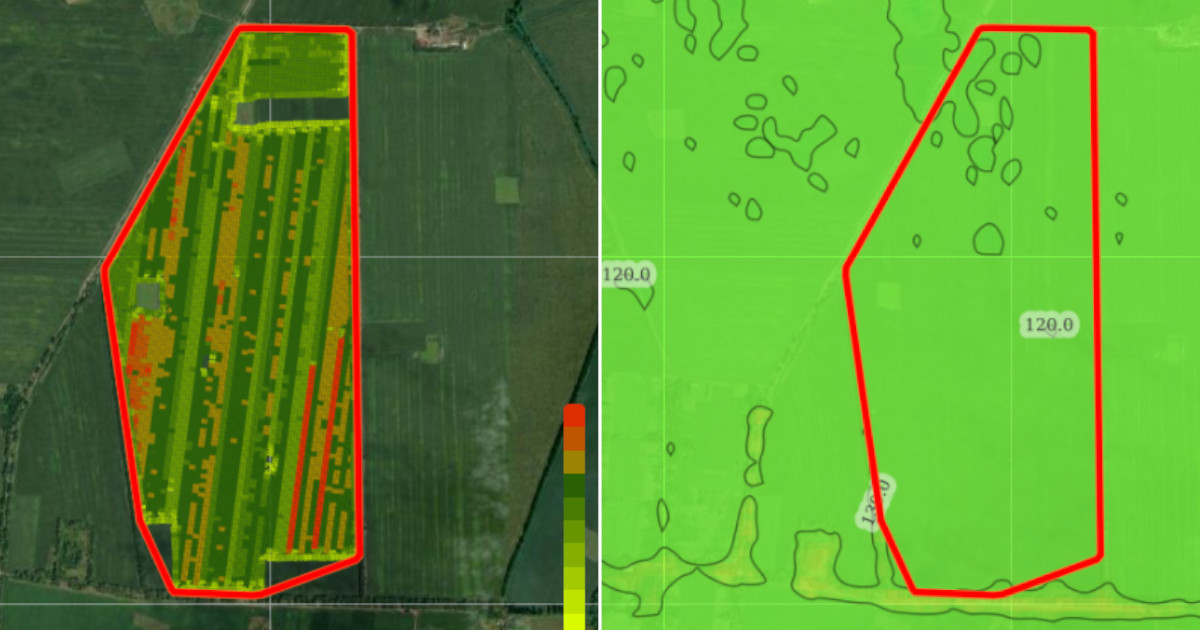
Soft.Farm's Cartograms and Field Analytics modules
To effectively manage yield data, the Soft.Farm system includes the "Cartograms" and "Field Analytics" modules:
1) The "Cartograms" module allows you to visualize the spatial distribution of yield in a field, quickly identify high- and low-yield zones, and analyze crop heterogeneity. This clear display of information helps quickly identify areas requiring additional attention.
2) The "Field Analytics" module allows for a more thorough analysis of the data obtained. You can compare results across different seasons, analyze yield dynamics, evaluate the effectiveness of agricultural practices, and identify the factors that most influence the final result.
The combination of these tools allows you to not only view a yield map but also use it as a basis for strategic decision-making.
Using yield maps and Soft.Farm's analytical tools helps:
- identify consistently productive and problematic areas of a field;
- optimize fertilizer and crop protection application rates;
- plan differentiated harvesting;
- increase resource efficiency;
- assess the economic feasibility of technological solutions;
- forecast yield potential for future seasons.
Therefore, a yield map is one of the most important sources of information for a modern agricultural producer. However, it only gains true value when the resulting data becomes the basis for in-depth analysis and management decision-making.
With the "Cartograms" and "Field Analytics" modules in Soft.Farm, farmers can not only accumulate data but also transform it into practical solutions aimed at increasing yields, optimizing costs, and increasing farm profitability.
Back to news list