Vegetation indices NDVI, EVI, GNDVI, CVI, True color
01.05 2015

Satellite crop monitoring is the technology for observing changes in the vegetation index obtained by spectral analysis of high-resolution satellite images. It is used on different fields or for individual crops and allows you to track the positive and negative dynamics of plant development. The difference in the dynamics of the vegetation index indicates imbalances in development within the same culture or field. This indicates the need of additional agricultural work in certain areas, therefore, this technology relates to precision agriculture methods.
The vegetation index is an indicator that is calculated as a result of operations with different spectral ranges of remote sensing data and is related to the vegetation parameters in a particular pixel of the image. The effectiveness of vegetation indices is determined by the characteristics of reflection. The calculation of most of the vegetation indices is based on two the most stable sections of the curve spectral reflectance of plants.
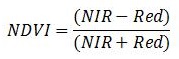
NDVI - normalized difference vegetation index. The most common in agriculture, characterizes the density of vegetation and allows farmers to assess germination, growth, the presence of weeds or diseases, as well as to predict the productivity of the fields. Index indicators are generated through satellite images of green mass, which absorbs electromagnetic waves in the visible red range and reflects them in the near infrared range. The red region of the spectrum (0.62 - 0.75 μm) accounts for the maximum absorption of solar radiation by chlorophyll, and the near infrared zone (0.75 - 1.3 μm) has the maximum energy reflection by the leaf cell structure. That is, high photosynthetic activity leads to lower values of the reflection coefficients in the red region of the spectrum and large values in the near infrared region of the spectrum. The ratio of these indicators to each other allows you to clearly separate the vegetation from other natural objects. As a result, it is possible to obtain a complete spectral analysis and identify areas that need reseeding, application of plant protection products or fertilizers. The index is moderately sensitive to changes in soil and atmospheric background, except in cases of poor vegetation, and can be saturated in conditions of dense vegetation, when the level of the leaf area index (LAI) becomes high.

EVI - enhanced vegetation Index. Developed to improve NDVI by optimizing the vegetation signal in areas with a high leaf area index (LAI). The index uses the blue reflection region to correct background soil signals and reduce atmospheric effects, including aerosol scattering. Most useful in high LAI regions where NDVI can be saturated. EVI values should range from 0 to 1 for vegetation pixels. Bright features such as clouds and white buildings, along with dark features such as water, can result in anomalous pixel values in an EVI image. It is used to assess the variability of crop development both in conditions of dense vegetation cover and in conditions of sparse vegetation.

GNDVI - green normalized difference vegetation index. It is similar to NDVI except that instead of the red spectrum it measures the green spectrum in the range from 0.54 to 0.57 microns. This is an indicator of the photosynthetic activity of the vegetation cover; it is most often used in assessing the moisture content and nitrogen concentration in plant leaves according to multispectral data which do not have an extreme red channel. Compared to the NDVI index, it is more sensitive to chlorophyll concentration. It is used in assessing depressed and aged vegetation.

CVI - chlorophyll vegetation index. It has an increased sensitivity to the content of chlorophyll in the deciduous cover. It is used from the beginning to the middle of the crop growth cycle for a wide range of soils and sowing conditions by analyzing a large set of synthetic data obtained using the reflection model of the leaf surface. The increased sensitivity of the index to the concentration of chlorophyll in the leaf is due to the effective normalization of various LAI values obtained with the introduction of red and green colors.

True Color - visual interpretation of the earth cover. A method of presenting and storing an image that allows you to display a large number of colors, halftones and shades. The true color image is displayed in a combination of red, green and blue stripes.
Back to news list