Monitoring Vegetation Indexes (NDVI) in Agriculture
05.12 2019
An integral part of any modern agricultural enterprise is the planning of agricultural operations and operational monitoring of the status of sowings. It allows to timely identify deviations in the growth and development of plants, determine the causes of these deviations and make appropriate management decisions. Today, there are many ways to monitor crops during the season. This is the agronomist’s exit into the field, analysis of soil samples, the use of data from drones and satellites, etc. There are a number of difficulties with an separate examination. It is still impossible to drive to the fields in early spring, although work needs to be planned based on the current status of the crop, and at the height of the season plants can reach two or more meters in height, which significantly complicates the analysis of crops in principle. As a result, it is impossible to see a complete picture throughout the field, which can lead to crop losses.
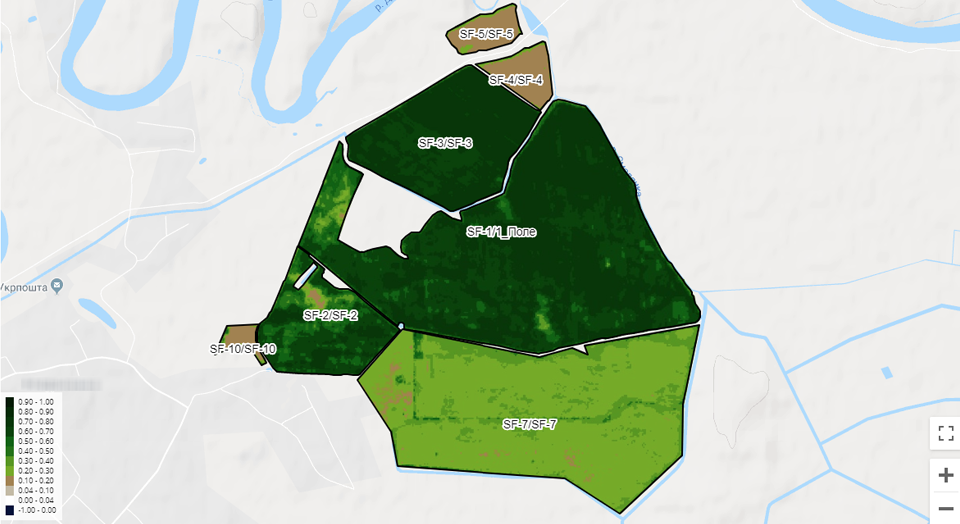
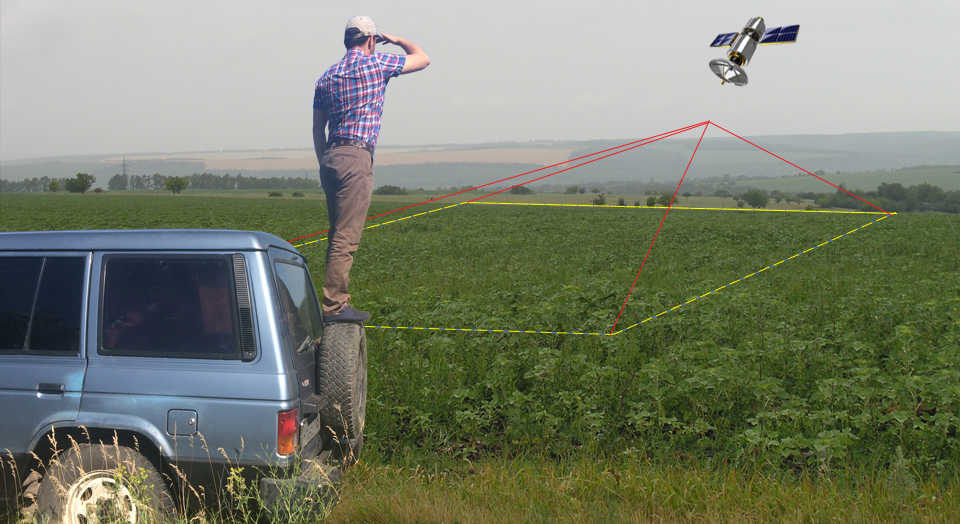
Satellite monitoring of crops comes to the rescue. This is a technology for observing changes in the vegetation index obtained using satellite imagery analysis. In agriculture, the most common is the normalized relative vegetative index NDVI (Normalized Difference Vegetation Index), which characterizes the density of vegetation and allows farmers to assess germination, growth, the presence of weeds or diseases, as well as to predict the productivity of the fields. Index indicators are formed through satellite images of green mass, which absorbs electromagnetic waves in the visible red range and reflects them in the near infrared. The larger the leaf surface of the plants and the more chlorophyll, that is, the green pigment in the leaves, the more the plants absorb the red light that enters them and reflect less. As a result, it is possible to obtain a complete spectral analysis and identify areas that need re-reseeding, application of plant protection agents or fertilizers.
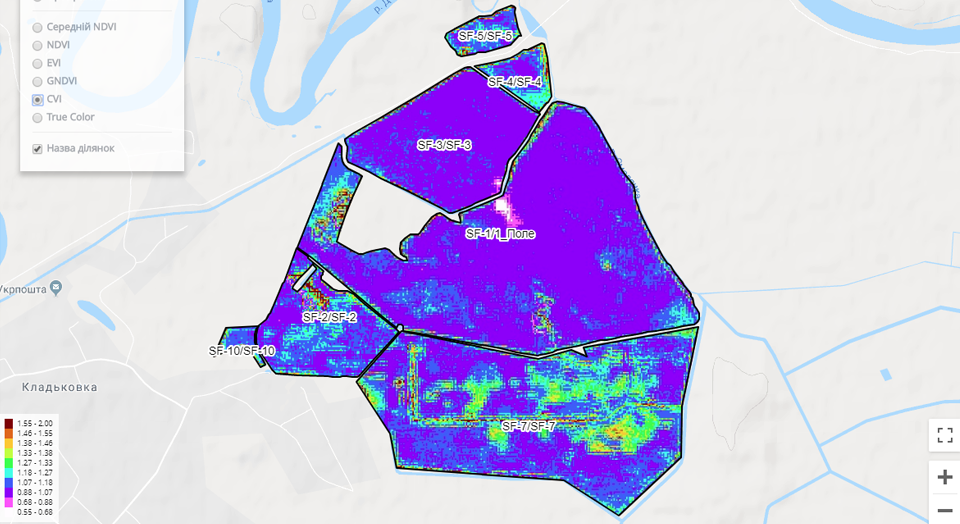
For a more detailed study of factors influencing the development of culture, the Soft.Farm team added the ability to analyze other vegetation indices to the system’s functionality. In addition to NDVI, you can use the indexes EVI (Enhanced Vegetation Index), GNDVI (Green Normalized Difference Vegetation Index), CVI (Chlorophyll Vegetation Index), as well as True Color, which characterize various qualitative and quantitative indicators in accordance with the needs of a particular enterprise.

Indexes are used in assessing the condition of crops at a certain point in time or in dynamics. They change throughout the season and their values differ during the growth, flowering and ripening of plants. At the beginning of the growing season, the index increases, at the time of flowering, its growth stops, then, as it ripens, it decreases. Depending on the factors and conditions of soil fertility, weather conditions and crop cultivation technology, the rate of biomass development will be different. Before sowing, the soil condition is mainly analyzed for the quality of pre-sowing soil treatment. At the germination stage, the level of plant losses is considered and the need for replanting or reseeding is determined. At the end of the growing season, with the help of satellite imagery analysis, it is possible to clarify the collection dates and finally predict yield.

The big advantage of using satellite imagery in Soft.Farm is its retrospectiveness. If the desired site is in the “field of view" of the satellite, you can get the history of such a site over the past few years, which will indicate the dynamics of biomass development in certain fields, as well as the most and least productive zones. If spectral images show problems from year to year in the same area of the field, it will be easier for the agronomist to identify various factors that impede the development of plants and eliminate or reduce their influence. An analysis of the NDVI index over the years will help optimally form a crop rotation or, for example, decide whether to invest in fertilizers or sow perennial grasses for feed.
Soft.Farm uses images from different satellites, which are distinguished by their specialization and frequency of passage over a specific area of the Earth. These are Landsat8 and Sentinel2, which are responsible for remote sensing.

One of the features of image analysis in Soft.Farm is the automatic calculation of areas with different vegetation, as well as the ability to group images by field, culture or date. Using a satellite, you can determine those areas where you need to make large fertilizer rates, as well as create electronic task maps for equipment. Such cards are used for differential application. A thorough analysis of various factors when constructing a task map can significantly reduce the consumption of fertilizers or plant protection products, reduce the cost of the production process, avoid the negative consequences associated, for example, with “overfeeding” plants, etc. In the vast majority of cases, it is necessary to carry out zoning of the field, which is impossible without the ability to observe the situation as a whole.

Technologies every day simplifies and improves the work of farmers. Satellite monitoring is becoming commonplace and is revolutionizing the look of agriculture. The agrarian remains to observe the crops throughout the growing season and identify deviations. The data obtained help to identify problem areas on the field for the implementation of precision farming.
Back to news list