Convenient analytics for land bank management
08.07 2021
A dashboard is a type of graphical interface that provides a visual presentation of key metrics relevant to a specific goal or process. Dashboards are dynamic reports in real time. They assist executives and managers in analytical work with a large number of constantly changing values.
Modern dashboards are intuitive. With a variety of widgets, they present data sets processed by analytic tools. Dashboards simply visualize the analysis results, display dynamics and highlight key indicators. The modular system focuses on the most important summary values that need to be monitored regularly and which play a decisive role in making management decisions.
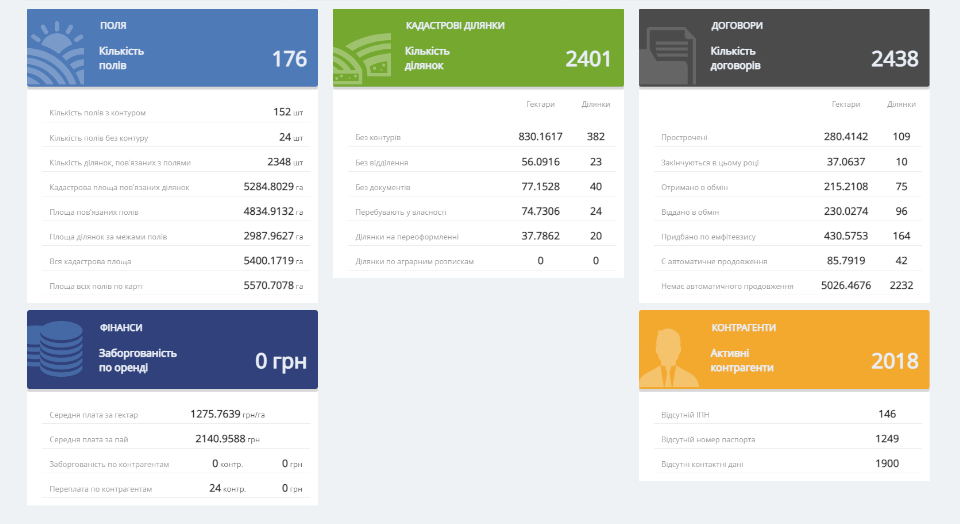
Our team is constantly supplementing, updating and improving the Soft.Farm system, and now we are presenting a new item of the cadastral module — «Analytics». The «Analytics» dashboard is a modern format for collecting and visualizing data arrays. To date, it contains five blocks that display all information on the land bank of an agricultural enterprise in real time, and allows you to monitor the key indicators of cadastral registration.

The «Fields» block visualizes data on the total number of fields in the farm and contains information about the number of fields with and without a polygon, about cadastral plots associated and unrelated to fields, plots outside the boundaries of fields, their area and other information.

The block «Cadastral land plots» contains information on the number of shares without contours, branches or documents, hectares and cadastral plots that are the property of an agricultural enterprise are counted, are currently being renewed or for which agrarian receipts have been signed.
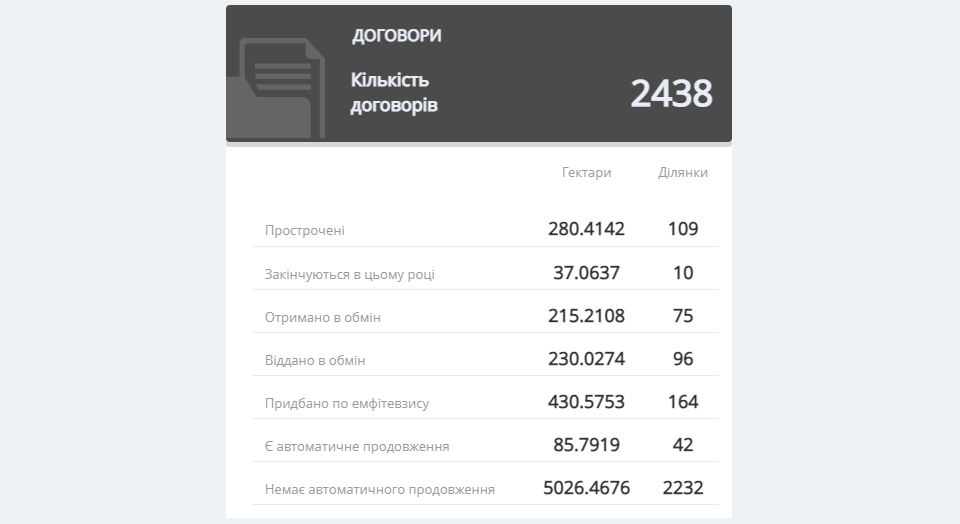
The «Agreements» block displays information about the number of cadastral plots for which there are already expired lease agreements or their term expires this year. It has data on how many shares were received and given by exchange, acquired by emphyteusis agreement and for how many plots the current agreement will automatically renew. The system calculates not only the cadastral plots, but also the hectares they occupy.

With the help of the «Finance» block, you can control the monetary component of the land bank of the farm. Taking into account the data entered into the system, it shows the average values of the rent per hectare and per share, and also displays the amount of debt and overpayment by the number of counterparties.

The «Counterparties» block visualizes the fullness of data. It displays the number of counterparties that do not have information about the taxpayer identification number, passport number, or do not provide contact information.
In short, a dashboard is a set of blocks that constantly collect and update information. Thanks to it, you can optimize work with large amounts of data and monitor the most important indicators for a quick response to changes. Now in the Soft.Farm web service, in addition to a filter system, visualization by tenants, the ability to export data to KML, Excel, Shape and Json, create PDF reports by field and a general reporting system, there is also such a type of analytics as a dashboard, which is already available to our users.
Back to news list